Tag: 神経科学

  • What Exactly Is YORU, a New Behavior Analysis Tool Powered by Object Detection?

    What Exactly Is YORU, a New Behavior Analysis Tool Powered by Object Detection?

    In November 2024, a preprint was posted on bioRxiv describing YORU, a behavior analysis tool that takes a different approach from existing behavior analysis tools.
    In this post, I would like to explain what kind of tool it is.

    YORU preprint

    YORU documentation

    What is YORU?

    YORU is a deep learning-based tool for analyzing animal behavior.

    YORUのサイトより引用


    Many deep learning-based tools, such as DeepLabCut and SLEAP, have already been released.
    These tools use deep learning to track animal body parts and estimate posture (here I will call them tracking tools).

    By estimating posture, they reveal what posture an animal is in and use this for behavior analysis.

    YORU, by contrast, recognizes behavior using an object detection algorithm.
    In short, it does not track body parts; instead, it defines behavior directly from the appearance of the behaving animal.

    When we distinguish an apple from an orange, we rely on cues such as shape and color.
    Object detection excels at classifying objects, so it makes exactly this kind of appearance-based distinction.

    Applying this to animal behavior analysis means classifying animal behavior from its appearance.
    Within YORU, this is referred to as a “behavior object.”

    Whereas tracking tools represent behavior as points and lines, YORU analyzes behavior by enclosing it in a bounding box.

    Advantages of defining behavior with object detection

    The advantages of object detection-based behavior analysis include:

    ・Errors are less likely even as the number of individuals increases

    ・Less affected by the animal’s orientation

    ・Fast analysis speed

    ・Can capture behaviors that are hard to detect by tracking (such as a mouse crouching)

    and so on.

    It overcomes a weakness of tracking tools by making multi-animal behavior analysis simple and far less computationally costly.
    It also makes it easy to analyze behaviors that are difficult to define from body part coordinates.

    Consider, for example, the actions of opening and closing a hand.
    With a tracking tool, you would track the fingertips with a camera and define the hand as open or closed, but if the fingertips become hidden when the hand closes, tracking fails and the positional information can no longer be computed accurately.

    With object detection, however, the model looks at the overall shape of the open and closed hand, so it can still make an accurate call even when part of the hand is occluded.

    As for robustness to increasing numbers of individuals: with a tracking tool, as the number of animals grows you must assign each body part to the correct individual in order to capture each animal’s behavior accurately, whereas YORU analyzes only the shape of each individual, so no identity assignment or part-to-individual matching is required.

    Because analysis is also fast, real-time analysis is possible—you can trigger device control when a particular behavior occurs, enabling automation of behavioral experiments.

    Disadvantages of defining behavior with object detection

    There are, of course, drawbacks as well:

    ・Cannot capture a behavioral sequence

    ・Cannot identify individuals

    ・Cannot capture unknown behaviors

    ・Cannot capture behaviors that are not visually distinctive

    ・Provides no fine-grained detail about the defined behavior

    These are precisely the strengths of tracking tools. Rather than one approach being better than the other, the two complement each other’s advantages and disadvantages.

    Experimenters therefore need to choose the approach that best suits their situation.

    What makes YORU remarkable?

    Having covered the advantages and disadvantages of the object detection-based behavior analysis that underlies YORU, what exactly makes YORU itself stand out?

    Everything runs through a GUI

    YORU lets you perform behavior analysis without writing any code.

    The same is true of tools such as DeepLabCut and SLEAP, and it goes a long way toward making these analyses accessible to biologists.

    Design


    Unlike previous tools, YORU’s design doesn’t really look like that of a research tool.

    Built-in real-time analysis

    Unusually for tools of this kind, YORU comes with a full GUI for real-time analysis.

    Building a real-time analysis system is not that hard if you can program to some degree, but otherwise the barrier is quite high.

    With YORU, however, you can carry out real-time analysis—and even fire external triggers—entirely without programming.

    Adaptable to a wide range of experimental setups

    The biggest hurdle in real-time analysis is figuring out how to combine the code that drives your own experimental apparatus with the analysis itself.

    YORU adopts a plugin system that lets you choose the program used to control your external devices.

    In other words, you simply select the plugin that matches your own system.

    You can also write your own plugins: simply turning your device’s control program into a plugin makes it easy to link that hardware to YORU’s real-time analysis.

    This makes for a remarkably user-friendly system that no other tool currently offers.

    Closing thoughts

    YORU has only just been released, so there are still rough edges in usability and clear gaps in the documentation.

    That said, as these are addressed over time, I am very much looking forward to seeing how people put it to use.

  • From GitHub Basics to Publishing Your Code Alongside a Paper

    Here are the slides from a talk I gave on how to use Git and GitHub.

    The slides cover everything from the basics of working with GitHub to the steps involved in publishing your code alongside a paper.

    Sharing paper data and analysis code is now routinely expected.
    Beyond that, managing code with GitHub has become an essential part of working on collaborative projects.

    [Updated January 15, 2024] https://www.slideshare.net/slideshow/embed_code/key/vzfmHD9i6I15wI

    From GitHub basics to code management and publishing your code with a paper from Hayato Yamanouchi

    The same material is also available on my personal site.

    Hayato M. Yamanouchi’s personal site

  • How to Install SLEAP [Updated February 2024]

    How to Install SLEAP [Updated February 2024]

    Here I’d like to walk through how to install SLEAP, a machine learning-based tool for tracking animal body parts.

    DeepLabCut is the best-known tracking tool, and I’ve written about how to install it myself in the past, while many others have posted articles about it as well.

    SLEAP, however, has relatively few articles written about it in Japanese.
    SLEAP has many advantages over DeepLabCut, so I decided to write up the installation procedure to make it a viable option for more people.

    SLEAP’s documentation covers everything from installation to usage very clearly, complete with videos, so anyone comfortable with English should find it easy to get started.

    The SLEAP paper is available here

    The official SLEAP website is here

    The SLEAP GitHub repository is here

    Introduction

    First, a note about the approach described in the official SLEAP installation guide:

    mamba create -y -n sleap -c conda-forge -c nvidia -c sleap -c anaconda sleap=1.3.3

    the one-line command that is supposed to handle environment creation, package installation, and everything else at once. I tried it on several computers, but in every case it hung indefinitely during the environment creation step and never completed.

    So in this post I’ll introduce the alternative installation method that the developers also suggest.

    Installation

    We’ll basically follow the installation instructions on the official SLEAP site.

    Environment

    ・Windows 11 Pro
    ・Verified on an NVIDIA 3080
    ・SLEAP 1.3.3
    ・Python 3.7.12

    Downloading the files

    First, download the files from the SLEAP GitHub repository to your computer.

    If you’re using Git, run the following command.

    git clone https://github.com/talmolab/sleap

    If the git command isn’t available, either install git or download the files directly from GitHub.

    Installing the GPU driver

    Install the NVIDIA driver.
    (Skip this step if it’s already installed.)

    Installing Anaconda

    Next, download and install the Windows 10 64-bit version from the Anaconda website.
    Click Free Download on the Anaconda site and scroll down; you’ll see a screen like the one below.
    Install the Windows installer on the far left.

    Once Anaconda is installed, you should find “Anaconda Prompt” in your Windows app list.
    We’ll use it to run the commands below to create the virtual environment, install the packages, and finally launch SLEAP.

    Creating the virtual environment and installing

    Next, run the following commands to create the virtual environment and install SLEAP.
    The environment will be named “sleap”.

    cd sleap
    conda env create -f environment.yml -n sleap

    Incidentally, the commands above work on computers with a GPU;
    on machines without one, use the following instead.

    cd sleap
    conda env create -f environment_no_cuda.yml -n sleap

    That completes the installation.

    Checking that the installation worked

    Activate the virtual environment and launch SLEAP with sleap-label.

    conda activate sleap
    sleap-label

    You’ll need to activate the virtual environment (the conda activate sleap command) every time you reopen Anaconda Prompt.

    After activating the environment, the prompt should change from (base) to (sleap).

    If it launches, the installation was successful.

    Checking version information for reporting in a paper

    To check the version, activate the sleap environment and then run the following command.

    python -c "import sleap; sleap.versions()"

    This outputs:

    SLEAP: 1.3.3
    TensorFlow: 2.7.0
    Numpy: 1.21.5
    Python: 3.7.12
    OS: Windows-10-10.0.22621-SP0

    which shows the SLEAP version and related information.

    To check whether SLEAP can use the GPU, run:

    python -c "import sleap; sleap.system_summary()"

    If the GPU is available, you’ll see output like the following.

    GPUs: 1/1 available
      Device: /physical_device:GPU:0
             Available: True
           Initialized: False
         Memory growth: None

    In future posts, I hope to walk through how to actually use SLEAP.

    Bonus

    For those who aren’t sure which computer to buy, I’ve started offering PC purchase consultations on Coconala!

    あなたの要望に合わせてパソコンを選び、提案します パソコン選びに困っている方々へ!様々な目的に対応できます!

    I often pick out computers and give advice about them, and many friends have told me I could make money doing PC consultations.
    That inspired me to give it a try!

    I’ll recommend a machine that fits both what you want to use it for and your budget.
    In particular, I’ve chosen and used many computers intended for machine learning.

    And if you’d like, I can also advise you on what to look for the next time you buy a computer.

    Computers I’ve picked out so far include lab analysis machines, everyday-use machines, game streaming machines, machines for incoming university students, machines that can run CAD for architecture students, and simple entry-level machines.

    I use both Mac and Windows, so I can discuss and recommend either one!

    Please feel free to make use of it.

  • A Roundup of Drosophila Research Tools and Databases

    Here I’ve compiled a memo-style list of research tools useful for working with the fruit fly (Drosophila).
    If anything is missing or if there is a tool you would like added, please leave a comment on the site or contact me at haya.m.yamano.neuro@gmail.com.

    This page is still under construction, so more information will be added over time.

    Last updated: December 1, 2023

    Databases

    FlyBase

    URL: https://flybase.org

    A comprehensive Drosophila database. In addition to gene sequences and expression data, it provides access to research papers and information about the Drosophila research community.

    FlyWire

    URL: https://flywire.ai

    NeuronBridge

    URL: https://neuronbridge.janelia.org

    FlyLight

    URL: https://www.janelia.org/project-team/flylight

    FlyCircuit

    URL: https://www.flycircuit.tw

    neuPrint

    URL: https://neuprint.janelia.org

    SCope

    URL: https://scope.aertslab.org

    Fly Cell Atlas

    URL: https://flycellatlas.org

    Paper:

    Stock Centers

    Bloomington Drosophila Stock Center

    URL: https://bdsc.indiana.edu

     The Drosophila stock center at Indiana University in Bloomington, USA.
    You can search not only by genotype but also by stock number (numbers beginning with BL).

    A wide variety of lines are stocked here, including GAL4, UAS, and RNAi lines.

    Vienna Drosophila Resource Center

    URL: https://shop.vbc.ac.at/vdrc_store/

     The Drosophila stock center at the Institute of Molecular Biotechnology (IMBA) in Austria. It holds a particularly large collection of RNAi lines.

    KYOTO Drosophila Stock Center

    URL: https://kyotofly.kit.jp/cgi-bin/stocks/index.cgi

     A stock center at the Kyoto Institute of Technology in Kyoto, Japan. It is the largest Drosophila stock center in Japan; the stock list can be downloaded from the site, and lines can be searched by group.

    KYORIN-Fly : Drosophila species stock center

    URL: https://shigen.nig.ac.jp/fly/kyorin/

     A Drosophila stock center at Kyorin University in Japan. It maintains a wide range of Drosophila species, and mutants of species closely related to Drosophila melanogaster can also be obtained here.

    Behavior Analysis Tools

    DeepLabCut

    URL: http://www.mackenziemathislab.org/deeplabcut

    Paper: Mathis A, Mamidanna P, Cury KM, et al. DeepLabCut: markerless pose estimation of user-defined body parts with deep learning. Nat Neurosci. 2018;21(9):1281-1289. DOI:10.1038/s41593-018-0209-y


    SLEAP

    URL: https://sleap.ai

    Paper: Pereira TD, Tabris N, Matsliah A, et al. SLEAP: A deep learning system for multi-animal pose tracking. Nat Methods. 2022;19(4):486-495.
    DOI:10.1038/s41592-022-01426-1

    UMATracker

    URL: https://ymnk13.github.io/UMATracker/

    Paper: Yamanaka O, Takeuchi R. UMATracker: An intuitive image-based tracking platform. J Exp Biol. 2018;221(16):1-5.
    DOI:10.1242/jeb.182469

    Ctrax

    URL: https://ctrax.sourceforge.net

    Paper: https://www.nature.com/articles/nmeth.1328

    FlyTracker

    URL:

    Paper:

    ID Tracker

    URL:

    Paper:

    TRex

    URL:

    Paper: https://elifesciences.org/articles/64000

    JAABA

    URL:

    Paper:

    Other Resources

    Brain and VNC template (JRC 2018 Brain templates)

    URL: https://www.janelia.org/open-science/jrc-2018-brain-templates

    Color-Depth MIP

    URL: https://www.janelia.org/open-science/color-depth-mip

    Dissection and Immunostaining Protocols

    URL: https://www.janelia.org/project-team/flylight/protocols

    Videos showing how to dissect adult and larval Drosophila, along with immunostaining protocols, are available here.

  • How to Install Python Video Annotator

    How to Install Python Video Annotator

    What is Python Video Annotator?

    Python Video Annotator is an application that lets you analyze recorded videos and annotate events within them along a timeline.

    Researchers in neuroscience and ethology can use it to record videos of animals and then analyze and quantify their behavior.
    For example, suppose you are recording mouse behavior and want to score events such as tongue extension, tail flicks, or ear movements.
    When does each event occur in the video, and how long does it last?
    Watching the video and logging everything in Excel each time quickly becomes overwhelming when you have defined many behaviors.
    With a tool like this, you can annotate the video directly and export the timing and event information.

    There used to be an open-source application for scoring animal behavior called VCode.
    The problem, however, is that it no longer runs on current computer operating systems.

    Python Video Annotator runs on modern PCs, retains the features you need, and can additionally be combined with external sensor data (such as pressure gauges) and behavior quantification tools like DeepLabCut, making it a very useful tool for researchers.

    How to install

    The official site describes the installation procedure in detail, but I could not get it to install properly on my machine. (Installing it directly may have caused conflicts with packages already present on my system.)
    So instead I followed the approach described on the GitHub page: building a virtual environment with Anaconda and installing there.

    It sounds complicated when written out, but the steps are actually very simple.
    As of now (October 20, 2021) it does not appear to support the latest macOS (Big Sur 11.6), though this will likely be fixed soon.
    For that reason, I will use Windows as the example here.

    That said, once you have installed Anaconda on macOS and can use the conda command, the steps are essentially the same, so please refer to this guide once support arrives. (For details, see my previous post.)

    Install Anaconda and open the Anaconda Prompt.
    Then create a virtual environment and activate it.

    conda create -n videoannotator python=3.6
    conda activate videoannotator

    Next, install the required packages.

    pip install opencv-python-headless pyqt5==5.14.1 pyqtwebengine==5.14.0

    Then install Python Video Annotator.

    pip install python-video-annotator

    Once the various processes finish, the installation is complete.

    To launch it, activate the virtual environment first, then run the command.

    conda activate videoannotator
    start-video-annotator

    If the software starts up, you are all set.

  • Arithmetic Operations in Bonsai

    Arithmetic Operations in Bonsai

    Bonsai is widely used for designing experiments in neuroscience and other fields.
    With Bonsai you can build sophisticated programs without writing code, and run them with precise synchronization.

    Because it is so simple, however, operations that would be trivial in ordinary programming—such as basic arithmetic—have to be done in a somewhat unintuitive way.
    Here I explain how to perform arithmetic in Bonsai, using MouseMove as an example.

    Below is what these arithmetic operations actually look like: from top to bottom, addition, subtraction, multiplication, and division.

    For clarity, I used the X and Y values of MouseMove as the example here.
    In practice, though, you can perform calculations on values obtained from other sensors as well.

    The key point in Bonsai is that, before performing an operation, you need to combine the two values using “Zip”.

    The contents of “Zip” take the form (value 1, value 2); its role is to bundle the two values at that moment into one.
    Each operation then computes on value 1 and value 2 accordingly.

    This is hard to explain in words, so try to get a rough intuition for it.
    Without “Zip”, the program would not know which value to multiply with which, so the calculation could not be performed. That is why the X and Y values must first be combined so that they correspond to each other.

    The names of the operators for each arithmetic operation are listed below.

    • Addition => Add
    • Subtraction => Subtract
    • Multiplication => Multiply
    • Division => Divide

    I have posted a demonstration below, so please take a look.

    <Example in action>

  • Bonsai as a visual programming language

    Bonsai as a visual programming language

    Bonsai is a visual programming language introduced in a 2015 paper.
    It allows you to acquire data from sensors and process it at the same time.

    A key feature of Bonsai is that complex processing pipelines can be assembled easily, much like putting together a puzzle, and the results of that processing can be checked in real time.

    Bonsai can also be combined with other analysis software (DeepLabCut, Open Ephys, BonVision, and so on) and with hardware (cameras, controllers, microcontrollers, etc.), making it highly extensible.

    Because you can carry out complex analysis and processing intuitively without having to learn a programming language that looks intimidating, anyone can use it easily, and it broadens the range of experiments you can run.

    The paper describing Bonsai is available here.
    You can install Bonsai from here.

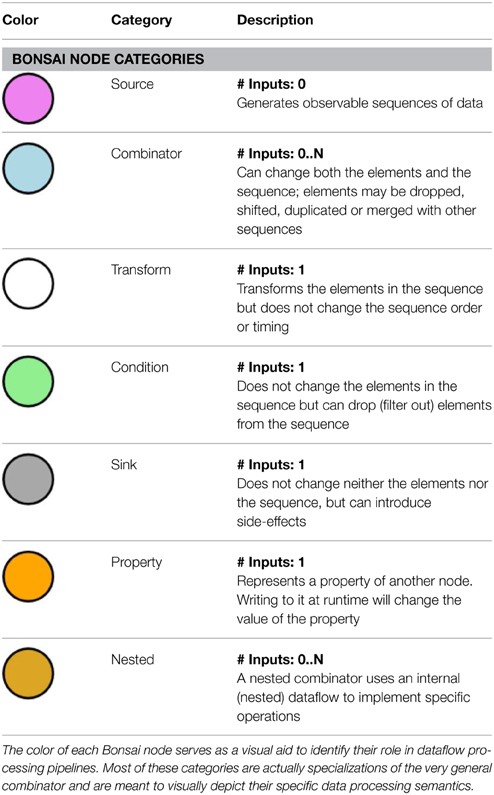
    Image taken from the paper.
    Each circle is called a node and represents an individual operation.

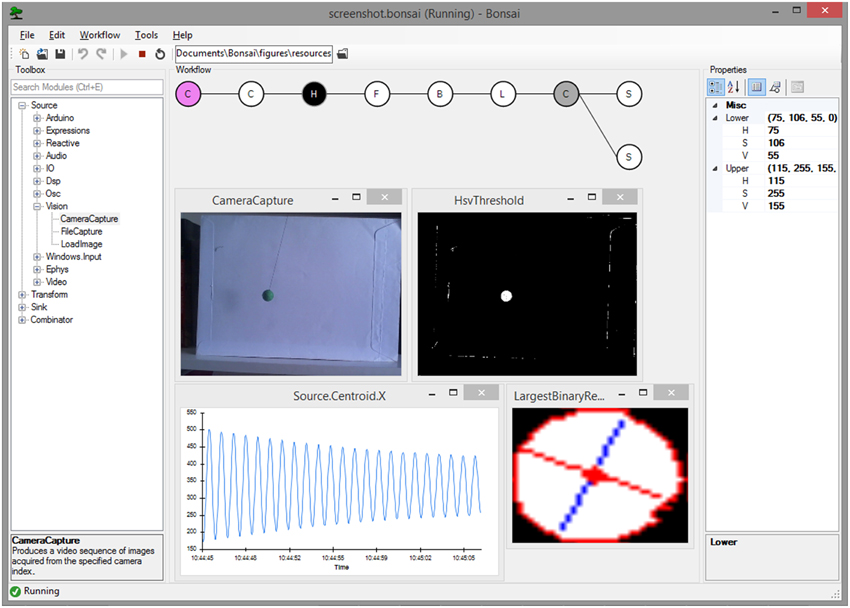
    This is what the screen looks like when Bonsai is actually running (taken from the paper).
    On the left you can search for nodes and add the one you need; in the central panel you arrange nodes to build up a pipeline while visualizing what it does; and on the right are the detailed settings for each node.

    The windows popping up in the main panel show the execution status of each node; for a camera capture node, for example, the live camera image can be displayed.

    It may look difficult at first glance, but seen this way it turns out to be surprisingly straightforward.

    Now let’s actually install it.
    That said, all you need to do is download it from this site.
    Just open the downloaded “Bonsai-*.*.*.exe” file and run the installer.
    Note that security software such as Trend Micro may block the installation.

    Once Bonsai is installed, both Bonsai and Bonsai (x86) will appear in your list of applications.
    For normal use either one is fine, but occasionally one of them will fail to run; in that case, trying the other one often works.

    One drawback is that Bonsai currently runs on Windows only, and is not supported on Linux or macOS.
    That may change in the future, but it is something to keep in mind.

    From the next post, I’ll start actually using Bonsai.